| Wednesday, 01 May 2024 |
|
Source: SEC Form 10-Q & Form 10-K Notes:
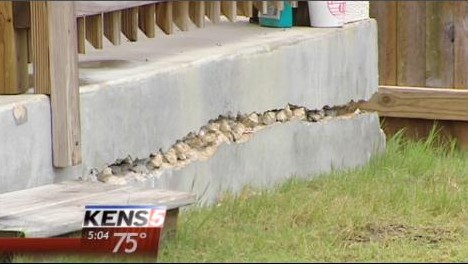
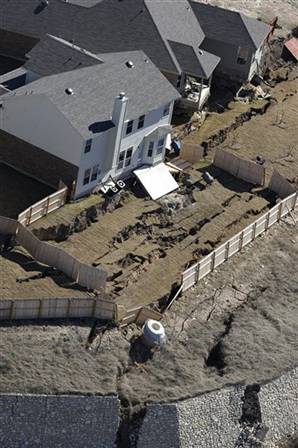
Arvida/JMB Partners developed master-planned residential and resort communities in the southeastern US before electing to call it quits. The communities included homes, townhouses, and condominiums and featured golf courses, tennis courts, swimming pools, and management services provided by the partnership. Arvida/JMB's communities were marketed toward middle- and upper-income residents in
Top U.S.-Based Warranty SpendersWarranty Week Full Report: Part 1 - 6 (2) Percent of warranted product revenue only; no finance, software or service revenue Reserve: balance as of
Warranty Claims & Accrual Rates, First Quarter 2003 to Second Quarter 2004 
Source: Warranty Week from SEC data |
|||||||||||||||||||||||||||||||||||||||||||||||||||||||||||||||||||||||||||||||||||||||||||||||||||||||||||||||||||||||||||||||||||||||||||||||||||||||||||||||||||||||||||||||||||||||||||||||||||||||||||||||||||||||||||||||||||||||||||||||||||||||||||||||||||||||||||||||||||||||||||||||||||||||||||||||||||||||||||||||||||||||||||||||||||
|
Warranty-Issuing
|
Product
|
Warranty
|
Percent
|
|
Parent Company
|
Revenue
|
Claims
|
of Sales
|
|
General Motors Co.
|
$38,777
|
$1,096
|
2.8% (2)
|
|
Ford Motor Co.
|
$34,200
|
$834
|
2.4% (2)
|
|
Hewlett-Packard Co.
|
$14,446
|
$581
|
4.0% (2)
|
|
Dell Inc. (1)
|
$8,851
|
$217
|
2.7%
|
|
IBM Corp.
|
$5,808
|
$190
|
3.3% (2)
|
|
Caterpillar Inc.
|
$4,424
|
$117
|
2.6% (2)
|
|
United Technologies
|
$4,864
|
$113
|
2.3% (2)
|
|
Sun Microsystems
|
$1,930
|
$106
|
5.2% (2)
|
|
Cisco Systems
|
$3,901
|
$80
|
2.3% (2)
|
|
Whirlpool Corp.
|
$2,716
|
$76
|
3.1%
|
|
Boeing Co.
|
$5,697
|
$69
|
1.2%
|
|
Deere & Co.
|
$3,071
|
$58
|
2.1% (2)
|
|
Gateway Inc.
|
$844
|
$47
|
6.2%
|
|
Lexmark International
|
$466
|
$45
|
9.7%
|
|
Lucent Technologies
|
$1,798
|
$44
|
3.5% (2)
|
|
Navistar International
|
$1,481
|
$44
|
3.0% (2)
|
|
Maxtor Corp.
|
$939
|
$42
|
4.5%
|
|
Paccar Inc.
|
$1,789
|
$42.4
|
2.4% (2)
|
|
Applied Materials Inc.
|
$1,000
|
$40
|
4.0%
|
|
Honeywell International
|
$4,619
|
$35
|
0.8% (2)
|
|
Seagate Corp.
|
$1,620
|
$33
|
2.0%
|
|
Maytag Corp.
|
$1,136
|
$31
|
3.1%
|
|
American Standard
|
$1,951
|
$28
|
1.5%
|
|
AutoZone Inc.
|
$1,121
|
$20
|
1.8%
|
|
Brunswick Corp. |
$935
|
$21
|
2.3%
|
|
|
|
|
|
|
Source: SEC Filings
|
|
|
|
|
Industry Category
|
Warranty Reserve
|
Warranty Claims
|
|
Automotive
|
$16.3 b
|
$2.3 b
|
|
Computers
|
$5.4 b
|
$1.4 b
|
|
Aerospace/Marine
|
$3 b
|
$298 m
|
|
Heavy Industry
|
$1.6 b
|
$279 m
|
|
Telecom Equipment
|
$1.47 b
|
$276 m
|
|
Home & Office Furn.
|
$646 m
|
$223 m
|
|
Electrical Power Equip.
|
$1.4 b
|
$199 m
|
|
Semiconductors
|
$554 m
|
$146 m
|
|
New Homes
|
$581 m
|
$126 m
|
|
Medical & Scientific
|
$435 m
|
$104 m
|
|
HVAC/R
|
$928 m
|
$97 m
|
|
Security Systems
|
$502 m
|
$69 m
|
|
|
|
|
|
Total
|
$32.87 b
|
$5.7 b
|
| < Prev | Next > |
|---|
|
|
| Search HOBB.org |
|---|
|
Beware of HOA Payment Plan! |
|
Reckless Endangerment |
|
Feature |
|
|
NPR Special Report |
|
Washington Post |
|
Arbitration Fairness Now! |
|
Judiciary & Civil Jurisprudence |
|
Arbitration Bill Passes Senate |
|
|
|
Texas Regulates Homebuyers |
|
TRCC Implosion |
|
IS YOUR STATE NEXT? |
|
OUTSTANDING FOX4 REPORT |
|
Perry's Gifts Keep on Talking |
|
TRCC AN ARRESTING EXPERIENCE |
|
How Texas Home Building Industry shaped the TRCC to regulate buyers |
|
Build it right the first time |
|
HUD's Broken System |
|
Take Action |
|
Voting Texas Style |
| Most Read |
|---|
|
|
Give Me Back My Rights Campaign |
|
Bad Binding Arbitration Experience? |
|
NCPIRG |
|
Drum Major Institute |
|
Homebuilding Texas Style |
|
Texas Homebuilder |
|
Texas Homebuyers |
|
POLICYHOLDERS OF AMERICA POLL |
|
REWARD |
|
Pulte Homeowner Survey |
|
Tort Reform Feature |
|
Special Money Report |
|
Letters to the Editor |
 |
|
© 2024 HomeOwners for Better Building
Joomla! is Free Software released under the GNU/GPL License.
|